Show guides, symbols, and page boundaries without removing your stitches.
Steps
Open Layers beside Palette in the editor. Turn a layer on or off with its visibility control.
Guides add heavier lines at the chosen interval, such as 10 × 10. They make it easier to count; they do not add stitches.
Symbols displays the chart's letters, numbers, or symbols when zoomed in enough. Open its settings to choose colored or uncolored boxes and the symbol style.
Page Breaks shows where a printable chart would be divided. Open its settings to adjust paper, orientation, margins, and symbol readability.
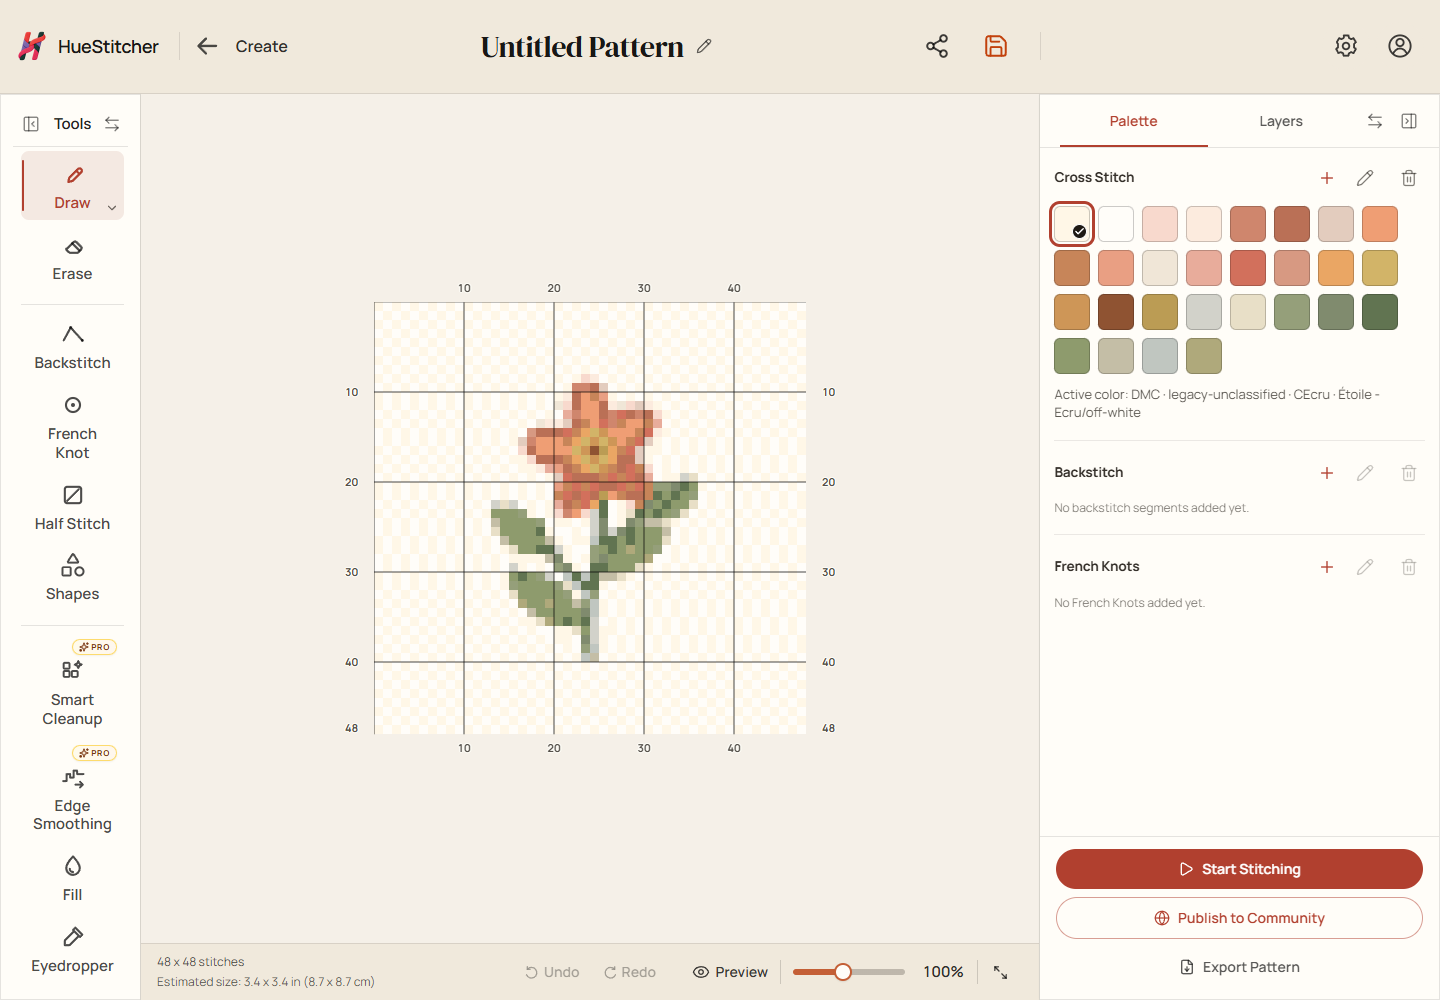
Example editor: tools are on the left, your chart is in the middle, and the palette is on the right. Small screens can be arranged differently.
Compare with your original image
If the pattern has a source image, Reference Image can show it behind the chart. Adjust the image and pattern opacity to compare or trace. A pattern without a source image cannot show this layer.
Look at the finished effect
Choose Preview near the chart to see a stitched representation. Close the preview to return to editing. Hiding a layer changes what you see, not the stitches saved in the pattern.